Congratulations on getting Google Analytics set up and running on your website(s)! This is a big step towards collecting better, more accurate info on your visitors, customers, and potential customers and can help open a whole new world of marketing possibilities. But now you might be staring at an unfamiliar wall of information, and frankly, that can be daunting. So we’re here to help you understand the basics of your Google Analytics Reporting.
Navigating Your Reporting Dashboard
If you have multiple websites under your Google Analytics account, the first thing you’ll see when logging in is a list of your sites. Once you select the site you want to analyze (or automatically if you only have one site), you’ll be taken to the “Home” page for your reporting dashboard, which by default contains at-a-glance looks at common report features. At the bottom of each reporting widget you’ll find a “_____ report” button that will let you view that report in full. Along the top you should find a way to switch websites and profiles, as well as a search bar (handy for if you’re having trouble finding the report you want). On the left side of your dashboard, you’ll find a navigation menu that acts as a sort of “table of contents” for your analytics reporting, and this is where you can really start to dig into all the different reporting categories at your disposal:
- Realtime Reports
Doing exactly what the name implies, all these reports show you website data in real-time, updated within seconds of each new pageview. This can be incredibly helpful for high-volume sites and sites that update with new content frequently.
For example, if your site posts new content multiple times a day, you can view in real-time which content is attracting the most attention.
- Audience Reports
Reports in this category give you useful data about exactly who’s visiting your website. From demographics like age & gender, to geographic location, what devices & operating systems they use, and even personal interests, Audience Reports are great for helping you build a profile of your website visitors and customers.
- Acquisition Reports
Are you curious where your web traffic is coming from? Are your visitors coming from Google searches? Social media recommendations? Links from other websites? All this info and more can be found in your Acquisition Reports. These reports don’t just stop at “where did they come from”; they can also help you identify which sources are most successful in leading to conversions, are best at keeping eyes on your site longer, are giving you the most new visitors, and more.
- Behavior Reports
Once a visitor reaches your site, these reports help you track what they’re doing. With Behavior Reports, you can see how visitors are navigating your site, which pages are most popular, where people leave (bounce) from the site, just to name a few options. This is also where you can view more technical metrics about your website, like page load speeds and suggestions for improvements.
- Conversion Reports
If your site includes e-commerce options, Conversion Reports allow you to easily track how many visitors turn into customers, where they may drop out of the process, and other elements of your sales funnel. Here you can also track progress towards custom “Google Analytics Goals” for visitor behavior, such as newsletter sign-ups, completed downloads, or average session times.
Reading Your Reports
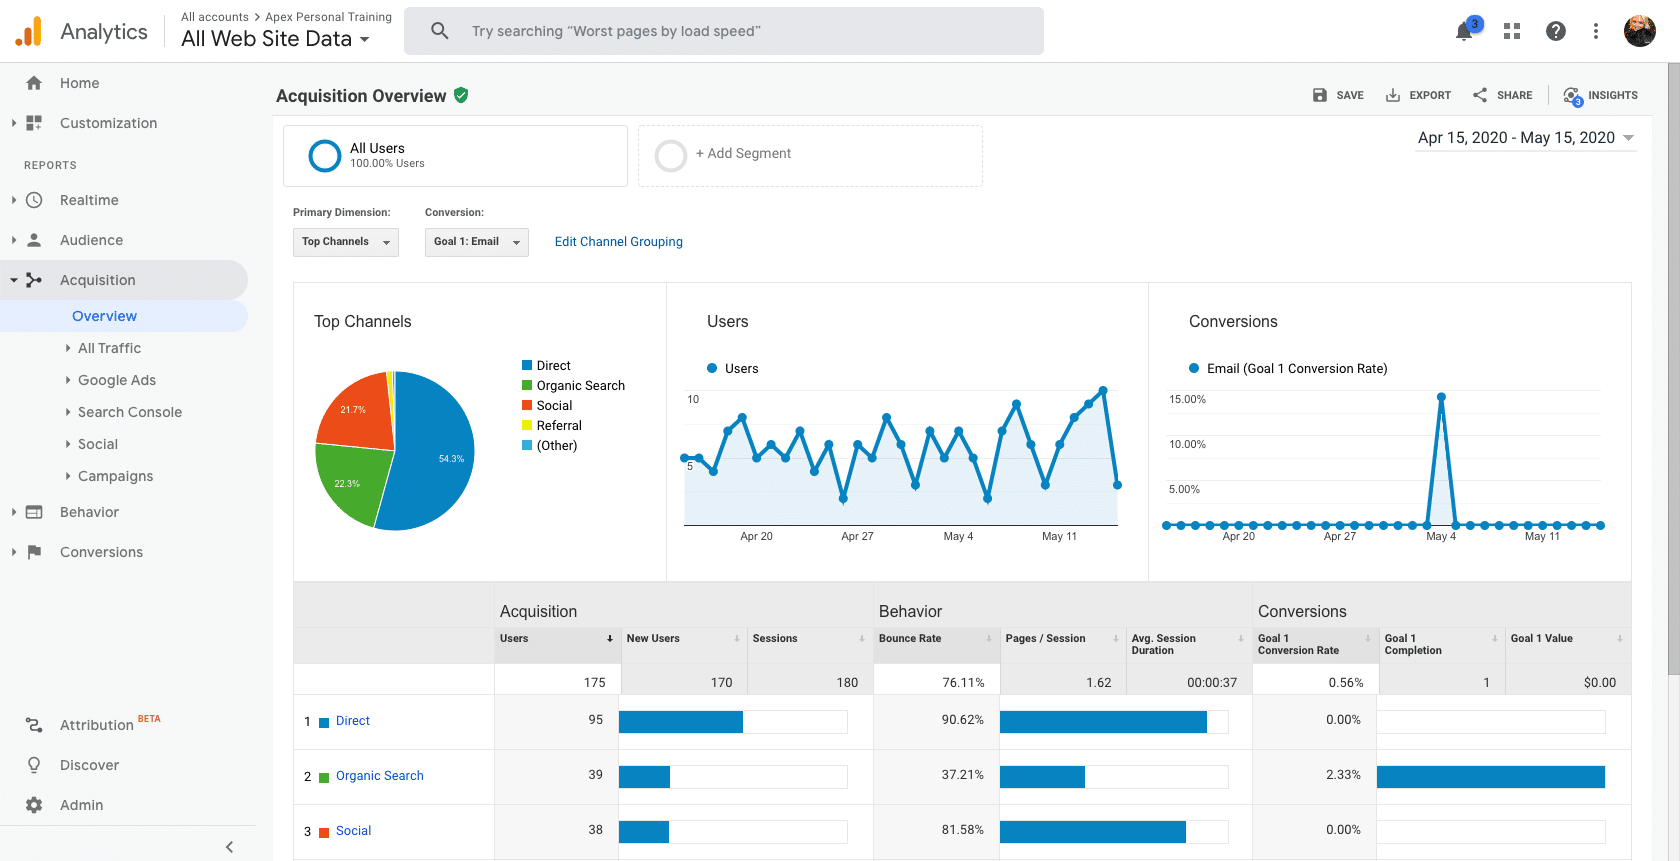
While every report is different and we encourage you to explore and play around with different reporting options, there are some basic reporting features that are universal to most reports. For this overview, we’ll use Reports>Acquisition>Overview as a common example.
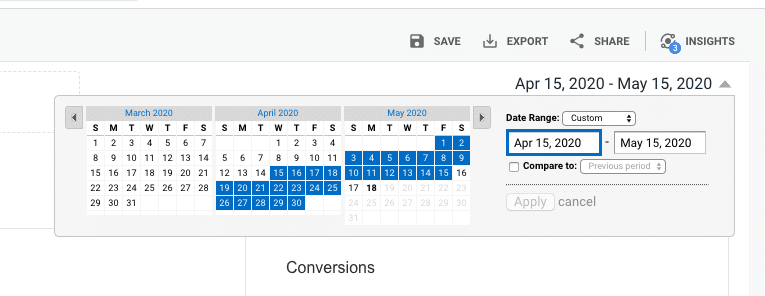
At the top-right of the report, you’ll find options for exporting, sharing, and editing the parameters (date range) of your report, as well as control over one of the most common variables: reporting period (just click on the reporting period to bring up a drop-down menu allowing you to select the period as well as set a comparison to a previous period).
Ex.)
Along the top-left of this report you can select from different dimensions or conversion options to discover what the top channels, sources, and mediums are for getting visitors to your website. Below, you’ll find a chart of the reporting data and a breakdown of the acquisition, behavior, and conversions (if applicable). At the bottom, you’ll find your reported info displayed in table form.
Once again, different reports may have more options specific to those reports, but this should provide a basic framework to help you navigate and explore the various reports Google Analytics has to offer.
Accessing and Sharing Your Reports
We know that not everyone has time to dig through mountains of information to get to what they want, and to that end, Google Analytics offers options to help you easily get the info you use most frequently. Earlier we mentioned that your dashboard “home” shows a quick view of frequently used reports, but this may differ from person to person and site to site. Below the “Home” option on the left side of your dashboard, you can access “Customization,” allows you to not only create custom reports to your exact specifications, but custom dashboards that include all (and only) the info that you use most.
You can also use email to easily share your reports with other members of your team. At the top of each report is an option to “share,” which allows you to email this report to people of your choosing, and even to automate a standing report daily, weekly, monthly, or quarterly. If you want to share more than one piece of data, you can create custom reports under the “Customization” tab mentioned above.
Of course, this overview barely scratches the surface of what’s capable with Google Analytics. We hope this helps you start to navigate and explore the information about your website that you now have at hand, but we also understand that the more you dig, the more questions are likely to spring up about your reports and your website data. Here at Skol Marketing, we offer periodic “Understanding Google Analytics” workshops to help answer your questions. If you’d prefer one-on-one guidance or would like to discuss how Google Analytics can inform your marketing strategy, please don’t hesitate to contact the local Google experts at Skol Marketing.


